Predicting the future is hard, especially when it comes to complex markets with disruptive variables that are difficult/impossible to model. In his excellent book Thinking Fast and Slow, Nobel winner Daniel Kahneman provides stark examples of how bad humans can be at doing just that.
In this excerpt, Kahneman details how he tracked the performance records of 25 professional wealth managers across eight years. He found that “[t]he results resembled what you would expect from a dice-rolling contest, not a game of skill.”
So, when folks ask me–as they increasingly do–”in light of SD-WAN, what does the future of MPLS look like?” I hesitate to take too definite a position, especially with strong opinions on either side.
That said, I think it’s helpful to look at what we do know and map the possible way those “curves” might move in the next five years.
This post is going to dive mostly into data we’ve collected as part of our recently refreshed WAN Manager Survey, as well as insights gained in last year’s survey effort and our WAN Summit series live polls.
From the start, SD-WAN vendors have touted that SD-WAN—with adequately diverse underlay connections—can functionally replace MPLS. Indeed, we’ve had more than one case study at our WAN Summits highlighting enterprises who have mostly, or even entirely, left MPLS behind. There are also those who have added SD-WAN as an enhancement to their MPLS solution.
And there's no doubt that an internet-based WAN can be much cheaper than an MPLS-based WAN. So where are most corporate networks today?
What Role Does MPLS Play in the WAN?
To answer that, we can look to the network configuration data we collected in the WAN Manager Survey in both 2018 and 2019.
We have network data from 93 different companies in 19 industries. These companies range in size from a dozen sites to 11,000. Most of these networks still rely primarily on MPLS, with an average of 67% of sites running MPLS.
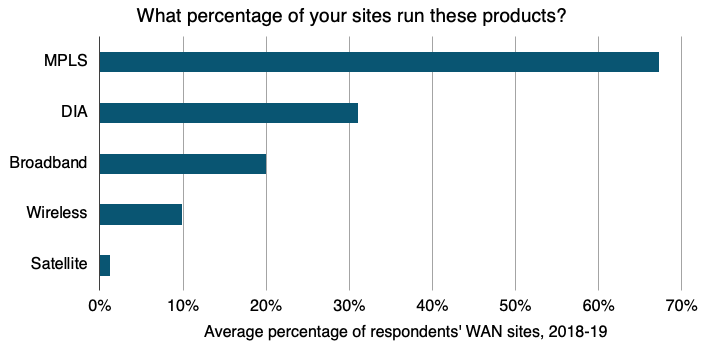
Notes: Each bar represents the average percentage of WAN sites using the listed products across all respondents.
This is a case where it helps to look not only at the average, but the full range of responses:
- 41% reported that they had MPLS running at 90% or more of their sites.
- 14% reported 100% MPLS coverage of their global sites.
- A quarter had MPLS installed at fewer than 50% of sites.
- 5% were running no MPLS.
This varies considerably by industry, too. When we broke out these trends by vertical, we saw that industrial companies had the least MPLS while healthcare companies continued to rely on it the most.
How Far Along is SD-WAN Adoption?
In our 2018 survey we asked enterprise WAN managers about their stage of adoption of SD-WAN. (We're also asking in the 2020 version we are running presently—which you should take if you are WAN manager!)
We found then that 83% of enterprises were at least considering SD-WAN, with 43% already adopted or in the roll-out phase. Those numbers have only gone up.

Notes: Each bar demonstrates the percentage of all 60 respondents who were in each stage of SD-WAN adoption in 2018.
We also asked about SD-WAN adoption through live polls at the WAN Summit for the past several years. The number of end-user attendees that have adopted SD-WAN has steadily risen.
This chart shows the average percentage of Summit delegates who responded “already installed SD-WAN on at least part of the network.” The four-year CAGR on these live polls is 83%. This means that each year the percentage of end-user delegates that have adopted SD-WAN is multiplied by 1.83.

Note: Chart demonstrates the average percentage of end-user delegates indicating that they have already installed SD-WAN at the given year across all WAN Summit event polls conducted in that year.
Does an Increase in SD-WAN Lead to a Decrease in MPLS Usage?
Our data demonstrates that those who already had SD-WAN installed were less likely to have a lot of MPLS left in the network.
Of those companies in our 2018 WAN Manager Survey that had already installed SD-WAN:
- The average number of sites with MPLS was only 53% (instead of 67% for the whole group).
- The median was even lower, at 40% —55% of respondents in this group had 40% of sites or fewer running MPLS.
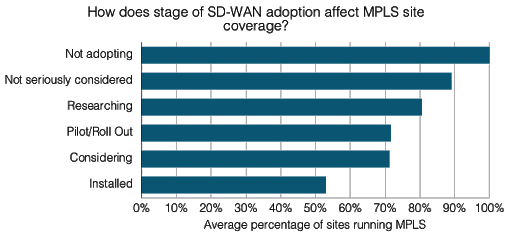
Notes: Each bar demonstrates the percentage of all 60 respondents who were in each stage of SD-WAN adoption in 2018 compared to the average percentage of sites running MPLS for respondents in that category.
What Are WAN Managers Plans for MPLS in the Near Future?
We know that SD-WAN adoption has increased, and we know that those who had SD-WAN installed have fewer sites running MPLS.
In 2018, we also directly asked respondents who were planning to adopt SD-WAN what their MPLS plans were. There, we still see some MPLS staying power:
- We found that 64% of that group planned to keep some MPLS on the network.
- Of that majority, 31% planned to lower the MPLS port sizes.
- So, of all respondents, about 33% will leave MPLS behind after SD-WAN, about 20% will lower MPLS after SD-WAN, and about 40% will keep MPLS the same after SD-WAN.
Again, we asked WAN Summit end-users similar questions over the years in our live polls and have seen these numbers shift.

Note: Chart demonstrates the average percentage of end-user attendees that indicated they will keep MPLS in the next year across all WAN Summit events held in that year.
Although there isn’t a smooth curve due to differences in responses at different events, the percentage of folks planning to keep MPLS at all or most sites in the next year has gone down from an average of 72% in 2016 to 58% across events in 2019.
The Data We Have Right Now
Let’s review what we do know about MPLS usage right now:
- Over four years of polls on how many WAN Summit delegates had already adopted SD-WAN, we have a CAGR of 83%. So, if an average of 34% of Summit end-user attendees had SD-WAN installed in 2019, we could expect it to be 61% in 2020 (assuming COVID-19 calms down and we get to have conferences in 2020).
- At that rate of growth—at least among the types of enterprises that go to a Summit—nearly everyone (less that tiny percentage who decided against SD-WAN) should have SD-WAN by 2021. In fact, it could be that COVID-19 and remote work drives adoption to even faster rates than we have seen. Certainly, roll-outs may go longer than expected, but it seems likely that a strong majority of enterprises will have SD-WAN running in the next couple of years.
- Enterprises that already have SD-WAN installed have fewer MPLS sites, with 55% having 40% or fewer sites running MPLS.
- About half of enterprises said they already have or plan to leave MPLS behind entirely—or at least reduce MPLS port sizes after installing SD-WAN.
The Crystal Ball Part: Does MPLS Stay or Go?
How do we extrapolate predictions? First, let’s look at what lends uncertainty:
- Our data is a relatively small set of the enterprise pool, and they may be self-selecting for various traits by participating in our conference or surveys. I would lean toward our respondents being earlier adopters; this puts a point in the “MPLS stays” column.
- WAN managers might change their minds about the ability of SD-WAN to truly replace MPLS functionality after they see SD-WAN at work, especially if they have some non-MPLS sites. Given what we have heard about SD-WAN functionality from all-internet case studies, I would put this factor likely in the “MPLS goes” column.
- Carriers might do something they have not yet done (future blog post to look out for) and drop MPLS prices to DIA levels. If MPLS prices start dropping much faster than DIA, of course this goes in the “MPLS stays” column.
- Exogenous factors—like, say, a pandemic-driven global recession—may put serious budget squeeze on IT infrastructure teams. This could lean toward “MPLS goes” as it is likely that even just pulling back on MPLS can save money. Though perhaps it could go toward “MPLS stays” if CIOs/CFOs are scared of rip and replace projects for new tech.
Now you’re saying, “Come on! Getting a straight answer from an analyst is like nailing jello to the wall.”
Well, ok. Here's what I think is the realistic range of possibilities (without doing the harder math, which we're working on for a new WAN market sizing tool).
- MPLS is extremely unlikely to disappear in the next two-three years. It's still installed at most sites in most corporate networks, and transitions don’t happen fast.
- SD-WAN is likely to become fairly ubiquitous in the next two-three years, but there will be a long tail of enterprises who are conservative, slow moving, or just not in the network tech loop.
- Once SD-WAN is running on a majority of networks, it's likely many, if not most, enterprises will be buying less MPLS. Bandwidth growth will more likely come from the cheaper DIA and broadband products even if MPLS is still around.
- If I am sitting in 2025—should we find MPLS prices stayed considerably higher than DIA and earlier adopters convince their peers that SD-WAN is replacing all security, priority, and availability needs MPLS meets (among other things)—then maybe MPLS will have gone the way of the Frame Relay/ATM and be left only on some legacy networks in need of an update.
- If in 2025 it turns out that carriers dropped MPLS prices down to or near DIA levels, including on the access end, and enterprises remain unconvinced that SD-WAN over the internet is as reliable (and SLA-protected) maybe most networks will be hybrids with MPLS sites still fairly common.
- Finally, in 2025, it’s perfectly plausible (maybe even likely) that MPLS is still in use where enterprises feel there is a particular need, but it’s a niche product—a shadow of its former dominant position in the market. Most sites on most networks run some combination of DIA, broadband, and even point-to-point with an SD-WAN overlay.