
Blog
Nov 14, 2022
Hypothetical Network Series #2: Tiered Sites Approach
Use of the internet in corporate WANs is quickly growing. And for good reason. Not only are internet...
Our latest Global Internet Geography Research Service refresh came with new pricing data.
And if you'd like a sample of this new data, you've come to the right place. Let's jump right in, shall we?
Providers’ shift to predominantly 100 Gbps internet backbones continues to reduce the average cost of carrying traffic and enables profitability at lower prices.
As a result, price erosion remains the universal norm. It reflects the introduction of competition into new markets and the response of more expensive carriers to lower prices.
Trends in the IP transit market generally follow regional trends of the transport market. And while some have suggested that price erosion may slow as a result of recent inflation and supply chain constraints (as it has in the wavelength market), we have not seen this trend make its way into the IP transit market.
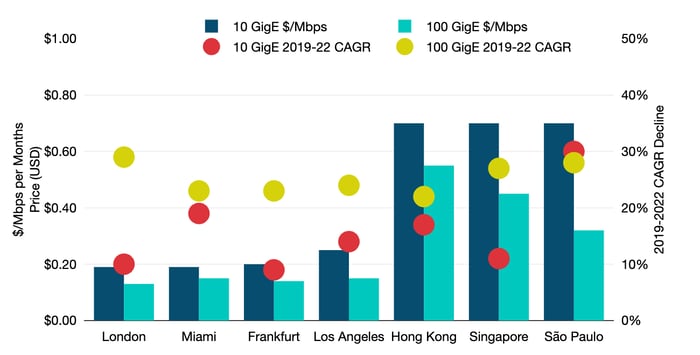
Across the cities included in the figure below, 10 GigE prices fell 16% compounded annually from Q2 2019 to Q2 2022. Over the same period, 100 GigE port prices fell 25%.
In Q2 2022, the lowest 10 GigE prices on offer were at the brink of $0.09 per Mbps per month. The lowest for 100 GigE were $0.06 per Mbps per month.
The sharper decline in 100 GigE reflects the advanced maturity of 10 GigE, as well as more carriers offering it and more competition. While 10 GigE remains a relevant increment of IP transit, particularly in more emerging markets, its share of the transaction mix continues to yield to 100 GigE.
In 2022, providers indicated that a majority of their sales mix in key U.S. and European hubs was now 100 GigE. On average, across the cities noted, the Monthly Recurring Charge (MRC) for a 100 GigE port was 6.7 times the MRC for a 10 GigE port. Operators are poised to adopt 400 GigE IP transit ports as the next fundamental upgrade from multiple 100 GigE ports.
For pricing, at least for now, carriers signal that they will start at or near four times the 100 GigE rate but expect that to decline.

Nov 14, 2022
Use of the internet in corporate WANs is quickly growing. And for good reason. Not only are internet...
Mar 28, 2022
While the key SD-WAN transformation use case was built around network cost and resiliency, its focus is...
Jul 18, 2022
To provide insight into how a complete SD-WAN overlay can impact total network spend, it’s useful to...